Standard reports/information in Google Analytics
Content
When you log-in to Google Analytics and access your site's dashboard, on the left hand side you will see a Standard Reports section. It is broken down into five parts: Real-Time, Audience, Acquisition (formerly Traffic Sources), Behavior (formerly Content) and Conversions. Below is a breakdown of the statistics you can find in these sections and a description of what they are and how to use them. You can set the time frame for your reports by setting the date in the upper right hand corner. Please refer to the Frequently Asked Questions section for how to holistically utilize these analytics.

Before you begin, there are some helpful, common statistics you will find across each of the aforementioned sections of the site. Below you will see examples of some of the areas where these figures can be found across the site:

More useful analytics found throughout the Google Analytics:
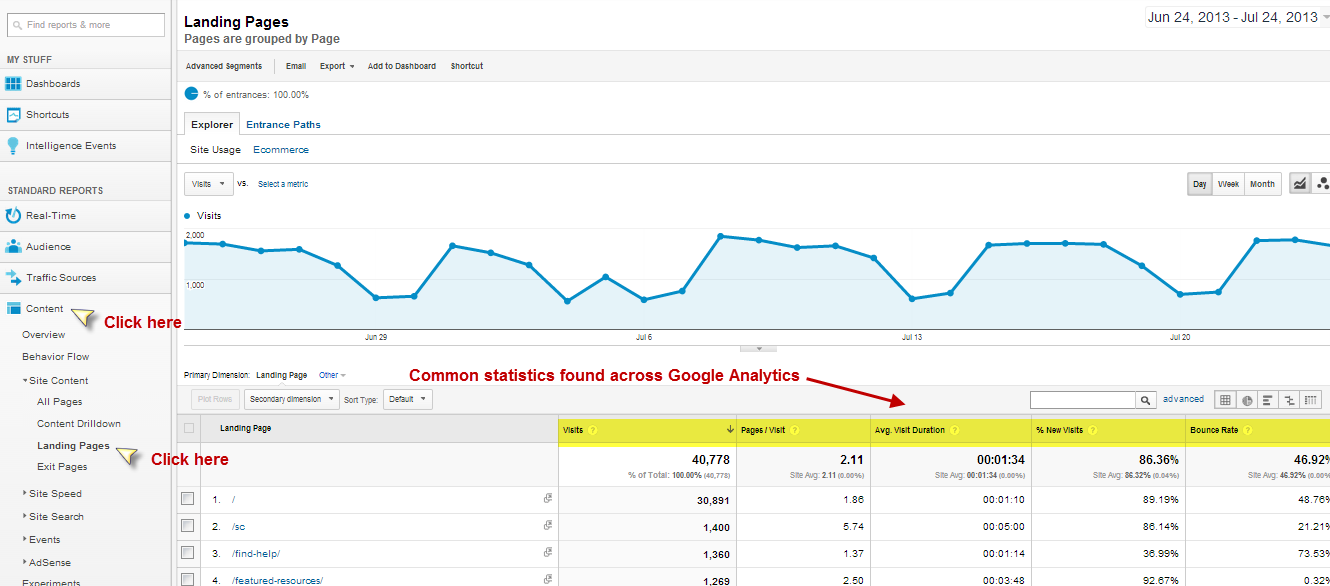
Listed below are those analytics aforementioned that can be found across the site:
- Page Views: The number of views each page has received.
- This number can be misleading due to the fact that the same computer visiting the same page repeatedly will count as more views, while site visitors hiding their cookies using something like Google Chrome Incognito Mode, or Firefox Private Browsing will not be counted. As such, the Page Views statistic is best used to monitor large noticeable trends over time. Also note that this does not include downloads of PDFs, Words documents, etc. You can find this as one of the variables measured in the Behavior Report and Audience Report sections.
- Unique Page Views: Similar to page views, but will not count repeat visitors more than once.
- Sessions: The number of individual sessions initiated by all the visitors to your page.
- If a user is inactive on your site for 30 minutes or more, any future activity is attributed to a new session. You can find this as one of the variables in the Audience Report section.
- Users: The number of visitors , or people accessing your page.
- You can find this as one of the variables measured in the Audience Report section.
- Unique Users: The number of people that come to your site in a selected date range.
- Clicks: The number of many times a link on your page was clicked by visitors.
- You can find this as one of the variables measured in the Content Report section.
- Bounce rate: The % of people who left a particular page without clicking or interacting with any of the content.
- This is one of the more frequently useful statistics, as a high bounce rate (35-50%) compared to the rest of the site can indicate that a page is confusing or not useful for the users; a well optimized site will be getting a majority of visitors that are actually looking for the information or services you have to offer up and therefore have a lower bounce rate. A high bounce rate can however be a good thing in certain contexts. A high bounce rate on certain resource pages without many links might indicate that the visitors have found the information they are looking for and don't need to look anywhere else after that. You can find this as one of the variables in the Behavior Report Section.
- Time Spent On Page: Roughly how long the average visitor spends on a page.
- Visitors walking away from their computer with the site still up, or having the site open in a tab while they are browsing elsewhere both count towards Time Spent On Page, and Google Analytics stops recording after a half an hour. Google Analytics also can't record time spent on site if the visitor exits a page to go to another website. These factors combine to make Time Spent On Page a very unreliable statistic. You can find this as one of the variables in the Behavior Report and Audience Report sections.
- Navigation Summary (Enter/Exit %): The Entrance and Exit % indicates what percent of your visitors arrive at the site on a particular page and exit on that particular page; the navigation summary gives you a sense of how users are navigating through the pages on your site.

Some of these metrics may seem very similar to one another. To help understand the difference a bit better, check out this Google Analytics resource. Not all metrics were mentioned; if you are curious about other analytics, visit the Google Analytics support site.
Real-time
In this section, you can find real-time analytics of your site. While an interesting function of the site, it is very limited in that it only displays what is currently occurring on your site. For this reason, this guide will not go into detail about this section, as the Audience, Traffic Sources, and Content sections of the Standard Reports will be more relevant to you and your stakeholders. If you would like to learn more, please see Google Analytics documentation on this section here.
However, please not that this real-time data may be useful to correlate the real-time impact of outreach activities like sending out an e-newsletter or publishing a resource link via social media.
Audience
In this section, you can find data on who is accessing your website.
- Demographics - Information on who is accessing your site by browser language setting and by location.
- You may infer that the language the browser is set to is the language of the user, but this is not always the case. Also, the location is determined by the IP address, not the physical location of the user.
- Behavior: Frequency and length of visits to your site
- Technology: What browsers and what service providers visitors are using when accessing your site.
- Mobile: This provides information on what what type of device people are using to access your site (desktop, mobile, or tablet).
- Custom
- User Flow: A graphical representation of the paths visitors took through your site,by the dimension you choose, through the various pages, and where along their paths they exited your site.
- It does not reveal why someone took a particular path, but may help identify problem areas on your site. Also note that the report is only based on a percentage of visits. For more information, please see this Google Analytics resource.
Acquisition (formerly Traffic Sources)
In this section, you can find details on how many people are visiting your site and what sources people are using to get to your site.
- Sources: Provides information on how users are getting to your site (whether by Google search, another website, etc.). It can also provide you with information on the keywords users enter to search for your site, through the Search section. This analytic is helpful in identifying where your major sources of traffic are coming from and can be used as a way to identify how you can get more traffic to your site, through link exchanges with that site or targeted ad campaigns.
- Search Engine Optimization: This section tells you what key terms people are using on search engines such as Google to get to your site, and the pages they are being taken to from the search engine.
- Social: You can find information on how users are getting to your site, specifically from social media sites such as Facebook. This can be helpful if you are working with social media to promote your site.
- Cost Analysis
- Advertising
Behavior (formerly Content)
- Behavior Flow: Provides information on the individual pages that page up your website and how your users interact with the content there.
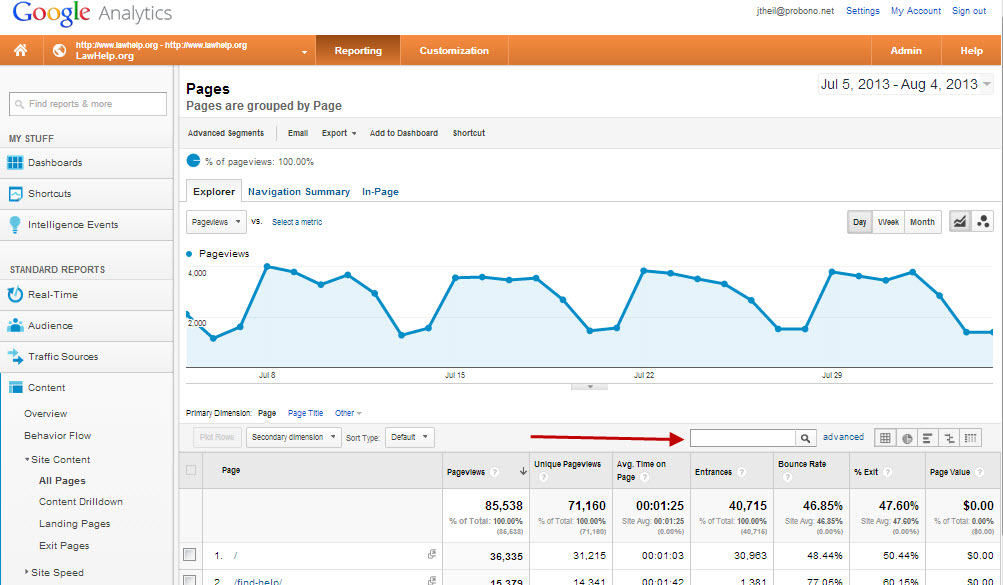
- Site Content: Provides analytics on individual pages of your website, including user behavior on those pages and user navigation through those pages. You can search for a particular resource by entering its URL in the search bar.
- Site Search: Provides insights to the ways visitors use the LawHelp site search bar. An unusually high number of searches for a certain resource might indicate a frequently sought resource that people have difficulty locating quickly on your homepage. This data can be used to inform how you use LawHelp.org's content widgets, mini-portals or other features to highlight popular content.
- Site Content: Provides analytics on individual pages of your website, including user behavior on those pages and user navigation through those pages. You can search for a particular resource by entering its URL in the search bar.
- Events: This is where Pro Bono Net developers have configured Google Analytics to display download and link data for your resources per LSC reporting requirements. An Event is counted whenever a visitor interacts with the content on your page in a predetermined way, such as clicking on one of your links, downloading a pdf, or watching a video. Events can also be a very useful tool for starting campaigns. For more information see Custom Reporting.
- Experiments
- In-Page Analytics: Lets you make a visual assessment of how users interact with your web pages and where they go on your website.
- This can be very helpful for people who are visual learners and who prefer to actually see an image of the LawHelp homepage with an overlay of what % of visitors clicked each individual link. This is a very quick and useful way to find out which areas of the LawHelp homepage are the most commonly used, and how people navigate.
Conversions
This section involves analytics that involve customization. Please see the section on Custom Reporting.
Additional Questions/Need Help?
Please contact the support@lawhelp.org HelpDesk with any Google Analytics questions.
Special thanks to Gwen Daniels and Lindsay Ditto at Illinois Legal Aid Online for additional input and guidance on using Google Analytics for statewide legal aid websites.