Google Analytics Toolkit
This toolkit will provide you with basic information on how Google Analytics works in the context of LawHelp. It provides an explanation of the standard analytics available and where you can find them, how to use the analytics, information on more customized statistics, additional resources, and frequently asked questions.
Be sure to also view the brief, introductory Guided Tour of Google Analytics below and for the latest updates, best practices, and resources on Google Analytics - check out our LawHelp Blog Feed below the jump.
What is Google Analytics?
Google Analytics is a free web tool that generates statistics about a website's traffic and traffic sources. Google Analytics is the main reporting system used by LawHelp.org sites.
Why is Google Analytics important?
Google Analytics helps you understand the traffic that comes to your website. Understanding this can help you with reporting to stakeholders, analyzing your site's content, identifying problem areas, and thinking through how to improve your LawHelp.org site.
How can I use Google Analytics for my needs?
There is no simple answer to this question. The analytics you might need and how you might need them depend on a number of factors. See the Frequently Asked Questions section of this Toolkit for a more detailed response to this question.
If I have additional reporting needs beyond Google Analytics, what can I do?
If your reporting needs are not met by Google Analytics, reach out to support@lawhelp.org. Here is what we will need to provide you with the report:
- A two-week notice so that our developers have time to run your report, as well as when you will need the report
- A date range for the required metrics
- What analytics you will need i.e. pageviews, users, etc. Please be specific
- What channel, topic, category, pages, etc you will need
- Any other additional information that may be relevant
What information will I need from Google Analytics for IOLTA and LSC reporting?
Please refer to the section on your LH3 site reporting needs for more information.
LawHelp Blog - Google Analytics
Standard reports/information in Google Analytics
Content
When you log-in to Google Analytics and access your site's dashboard, on the left hand side you will see a Standard Reports section. It is broken down into five parts: Real-Time, Audience, Acquisition (formerly Traffic Sources), Behavior (formerly Content) and Conversions. Below is a breakdown of the statistics you can find in these sections and a description of what they are and how to use them. You can set the time frame for your reports by setting the date in the upper right hand corner. Please refer to the Frequently Asked Questions section for how to holistically utilize these analytics.

Before you begin, there are some helpful, common statistics you will find across each of the aforementioned sections of the site. Below you will see examples of some of the areas where these figures can be found across the site:

More useful analytics found throughout the Google Analytics:
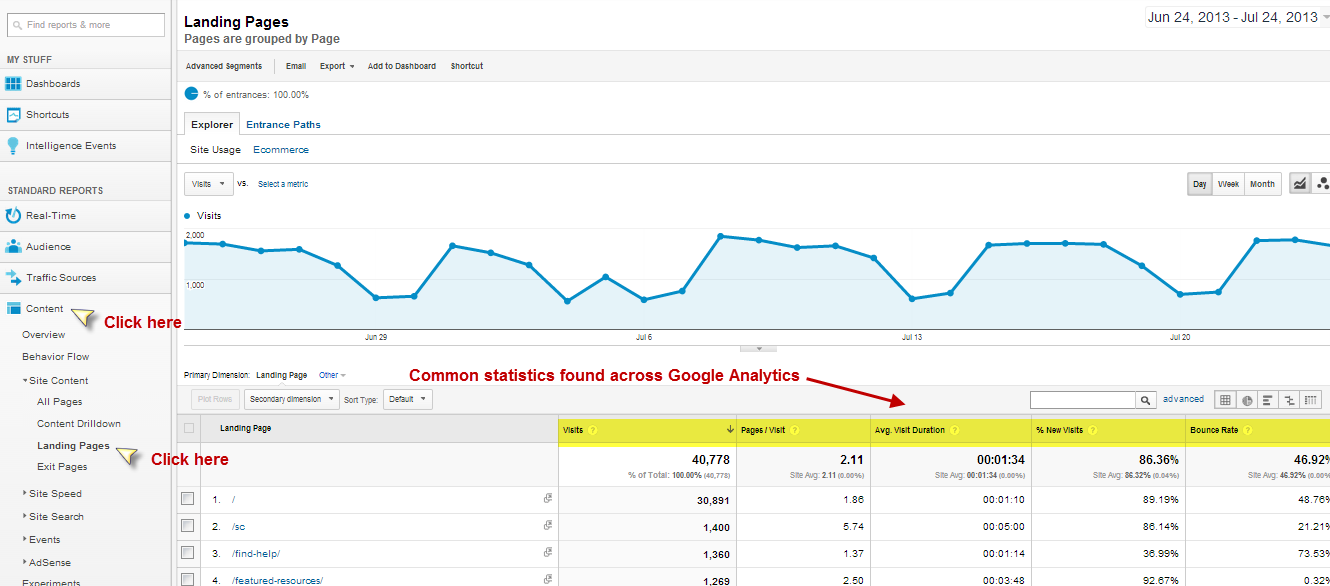
Listed below are those analytics aforementioned that can be found across the site:
- Page Views: The number of views each page has received.
- This number can be misleading due to the fact that the same computer visiting the same page repeatedly will count as more views, while site visitors hiding their cookies using something like Google Chrome Incognito Mode, or Firefox Private Browsing will not be counted. As such, the Page Views statistic is best used to monitor large noticeable trends over time. Also note that this does not include downloads of PDFs, Words documents, etc. You can find this as one of the variables measured in the Behavior Report and Audience Report sections.
- Unique Page Views: Similar to page views, but will not count repeat visitors more than once.
- Sessions: The number of individual sessions initiated by all the visitors to your page.
- If a user is inactive on your site for 30 minutes or more, any future activity is attributed to a new session. You can find this as one of the variables in the Audience Report section.
- Users: The number of visitors , or people accessing your page.
- You can find this as one of the variables measured in the Audience Report section.
- Unique Users: The number of people that come to your site in a selected date range.
- Clicks: The number of many times a link on your page was clicked by visitors.
- You can find this as one of the variables measured in the Content Report section.
- Bounce rate: The % of people who left a particular page without clicking or interacting with any of the content.
- This is one of the more frequently useful statistics, as a high bounce rate (35-50%) compared to the rest of the site can indicate that a page is confusing or not useful for the users; a well optimized site will be getting a majority of visitors that are actually looking for the information or services you have to offer up and therefore have a lower bounce rate. A high bounce rate can however be a good thing in certain contexts. A high bounce rate on certain resource pages without many links might indicate that the visitors have found the information they are looking for and don't need to look anywhere else after that. You can find this as one of the variables in the Behavior Report Section.
- Time Spent On Page: Roughly how long the average visitor spends on a page.
- Visitors walking away from their computer with the site still up, or having the site open in a tab while they are browsing elsewhere both count towards Time Spent On Page, and Google Analytics stops recording after a half an hour. Google Analytics also can't record time spent on site if the visitor exits a page to go to another website. These factors combine to make Time Spent On Page a very unreliable statistic. You can find this as one of the variables in the Behavior Report and Audience Report sections.
- Navigation Summary (Enter/Exit %): The Entrance and Exit % indicates what percent of your visitors arrive at the site on a particular page and exit on that particular page; the navigation summary gives you a sense of how users are navigating through the pages on your site.

Some of these metrics may seem very similar to one another. To help understand the difference a bit better, check out this Google Analytics resource. Not all metrics were mentioned; if you are curious about other analytics, visit the Google Analytics support site.
Real-time
In this section, you can find real-time analytics of your site. While an interesting function of the site, it is very limited in that it only displays what is currently occurring on your site. For this reason, this guide will not go into detail about this section, as the Audience, Traffic Sources, and Content sections of the Standard Reports will be more relevant to you and your stakeholders. If you would like to learn more, please see Google Analytics documentation on this section here.
However, please not that this real-time data may be useful to correlate the real-time impact of outreach activities like sending out an e-newsletter or publishing a resource link via social media.
Audience
In this section, you can find data on who is accessing your website.
- Demographics - Information on who is accessing your site by browser language setting and by location.
- You may infer that the language the browser is set to is the language of the user, but this is not always the case. Also, the location is determined by the IP address, not the physical location of the user.
- Behavior: Frequency and length of visits to your site
- Technology: What browsers and what service providers visitors are using when accessing your site.
- Mobile: This provides information on what what type of device people are using to access your site (desktop, mobile, or tablet).
- Custom
- User Flow: A graphical representation of the paths visitors took through your site,by the dimension you choose, through the various pages, and where along their paths they exited your site.
- It does not reveal why someone took a particular path, but may help identify problem areas on your site. Also note that the report is only based on a percentage of visits. For more information, please see this Google Analytics resource.
Acquisition (formerly Traffic Sources)
In this section, you can find details on how many people are visiting your site and what sources people are using to get to your site.
- Sources: Provides information on how users are getting to your site (whether by Google search, another website, etc.). It can also provide you with information on the keywords users enter to search for your site, through the Search section. This analytic is helpful in identifying where your major sources of traffic are coming from and can be used as a way to identify how you can get more traffic to your site, through link exchanges with that site or targeted ad campaigns.
- Search Engine Optimization: This section tells you what key terms people are using on search engines such as Google to get to your site, and the pages they are being taken to from the search engine.
- Social: You can find information on how users are getting to your site, specifically from social media sites such as Facebook. This can be helpful if you are working with social media to promote your site.
- Cost Analysis
- Advertising
Behavior (formerly Content)
- Behavior Flow: Provides information on the individual pages that page up your website and how your users interact with the content there.
- Site Content: Provides analytics on individual pages of your website, including user behavior on those pages and user navigation through those pages. You can search for a particular resource by entering its URL in the search bar.
- Site Search: Provides insights to the ways visitors use the LawHelp site search bar. An unusually high number of searches for a certain resource might indicate a frequently sought resource that people have difficulty locating quickly on your homepage. This data can be used to inform how you use LawHelp.org's content widgets, mini-portals or other features to highlight popular content.
- Site Content: Provides analytics on individual pages of your website, including user behavior on those pages and user navigation through those pages. You can search for a particular resource by entering its URL in the search bar.
- Events: This is where Pro Bono Net developers have configured Google Analytics to display download and link data for your resources per LSC reporting requirements. An Event is counted whenever a visitor interacts with the content on your page in a predetermined way, such as clicking on one of your links, downloading a pdf, or watching a video. Events can also be a very useful tool for starting campaigns. For more information see Custom Reporting.
- Experiments
- In-Page Analytics: Lets you make a visual assessment of how users interact with your web pages and where they go on your website.
- This can be very helpful for people who are visual learners and who prefer to actually see an image of the LawHelp homepage with an overlay of what % of visitors clicked each individual link. This is a very quick and useful way to find out which areas of the LawHelp homepage are the most commonly used, and how people navigate.
Conversions
This section involves analytics that involve customization. Please see the section on Custom Reporting.
Where can I find statistics for grant reports?
As as an LH3 website administrator, you will most likely be required to provide data for reporting purposes. Many of you will have LSC and IOLTA reporting needs; Google Analytics can be used to gather some of the information for these reports. This section will cover how to retrieve data from your Google Analytics reports for these two major reports.
IOLTA Reporting
IOLTA asks the number of visitors to your site. You can access this information in the Audience Reports section, under the users statistic.
IOLTA also requires information on the number of people who receive pro se assistance and the number of people who receive community legal education. Google Analytics can provide information on the number of people who retrieved the downloaded resources or viewed them that fall under those specific classifications. You can access page views of specific pieces of content in the Behavior Reports section. For download metrics on specific resources, you can access the information in Google Analytics, but please contact support@lawhelp.org for download metrics on specific topics, categories, or channels.
LSC Reporting
There are two LSC Grant Activity Report (GAR) metrics that can also be found in Google Analytics. The first is the total number of unique visitors to your website - for example, the total number of computers accessing websites) for any purpose, including but not limited to community legal education. Accessing unique users statistics from Google Analytics will satisfy this LSC Reporting requirement.
LSC also requires the total number of legal education materials posted on websites that were downloaded and the total number of self-help/ pro se materials posted on websites that were downloaded. For download metrics on specific resources, you can access the information in Google Analytics, but please contact support@lawhelp.org for download metrics on specific topics, categories, or channels or view the FAQ section for more details.
If you have additional reporting needs or questions, please see our FAQ section.
Customizing Google Analytics
Google Analytics allows users to customize their Google Analytics experience in ways that are more relevant. You may want to bring in outside resources for assistance with the configurations discussed below. Be sure to view the Other Resources section for more information.
Custom Reports
Creating custom reports allows you to monitor your LawHelp site in ways that are more relevant. The Customization option is available near the top of the screen next to "Reporting". The options that can be selected in a custom report are extensive, and by choosing to monitor or exclude particular metrics or dimensions you can create reports that provide you with a lot more detail. Google provides some step by step instructions on the basics of creating Custom Reports, as well as some extra information about custom reports. The Analysis Exchange program is also available to help create and monitor some custom reports.

Custom Dashboards
The dashboard option allows you to view many metrics all condensed into a central location. Dashboards are highly customizable and be altered to display your more valuable metrics. Google provides step by step instructions on how to do so in their Help Section. You can also find a number of Custom Dashboards created by others and shared online.
Custom Variables
You can create custom variables to tell you more about the individual categories that visitors belong to in order to learn more about the ways that visitors interact with your site. This is generally used to track customer purchases, but if you have specific ideas for types of visitors you would like to track, parameters can be set-up to monitor their activity specifically. The information from your custom variables will be located under the "Audience" section under the "Custom" tab. The Google summary of Custom Variables can be found here, while a more technical explanation is located here. You may want to bring in outside resources for assistance with configuration.
Campaigns
The most important tool Google Analytics offers for monitoring the successes of promotional efforts is the ability to Tag and track links. Tagging a link a subtle way to view where your visitors are coming from. When sending out a link to your LawHelp site or to a particular resource you can make slight alterations to the link using a Google Analytics URL builder, available here. The tagged link can then be sent out in an email to a listserv, posted on social media, or used in other online advertisements and announcements to monitor how many people arrive at your website from each campaign. If you happen to be utilizing Google Adwords, Google will automatically tag and monitor your links. There are a number of resources that provide further information on link tagging, including this article. Again, you may want to bring in outside resources for assistance with configuration.
Links can also be tagged in a way to measure offline marketing campaigns, such as print advertisements. The links that have been altered for tracking in online campaigns can be awkward and hard to remember for print advertisements, so instead you can create a slightly altered URL for your print ads that will redirect visitors automatically to your main homepage, but will also provide you with the number of visitors who came to your site from your printed ad campaign. A more detailed explanation of tracking offline campaigns can be read here.
Conversions
A conversion on Google Analytics represents a visitor interacting with the site in a pre-determined way, such as clicking a specific link, downloading a specific file, or signing up to a mailing list. The concept of Conversions in Google Analytics typically is used to represent "someone who spent money on our website". This feature can still be used if there is something specific that you would like to monitor in terms of a campaign, such as how many people click a link to your site from a newsletter associated with a campaign. You can monitor conversions by setting Goals, instructions for which can be found here. You may want to bring in outside resources for assistance with configuration.
Experiments
Google Analytics also offers an experiment feature which can help you to test and compare promotional campaigns, or aspects of your website. You can create as many as five different versions of your landing page and compare the data relating to Conversions, which are the fulfillment of certain goals you have set. In this way you can test and learn about what version of a landing page provides for example, the lowest bounce rate, or the highest number of unique page views. Experiments can be created using the "Start Experimenting" button under the Experiments section in the Content Reports section. Again, you may want to bring in outside resources for assistance with configuration.
Frequently Asked Questions
Content
- How can I access Google Analytics?
- Can I create a shortcut/ save an analytic or setting I want to repeatedly access?
- What are the limitations of Google Analytics and what are my options for working around these limitations?
- Why are my Google Analytics metrics different from other analytics tracking numbers?
- If I have additional reporting needs beyond Google Analytics, what can I do?
- What information will I need from Google Analytics for IOLTA and LSC reporting?
- Does Google Analytics provide information of downloads?
- How can I find information for:
- How do I determine which analytics are right for me?
How can I access Google Analytics?
You can access Google Analytics by going to www.google.com/analytics. You can sign-in with the log-in information that was provided to you when your LH3 site was launched. If you do not have this information, please email support@lawhelp.org. Once you log-in, you will be able to access your LH3 site, and if you have them, your mobile and mirror site Google Analytics resources. Select the appropriate LH3 site profile and you will be taken to your Google Analytics Reporting Dashboard for that site.
Can I create a shortcut/ save an analytic or setting I want to repeatedly access?
Yes. Your options for doing this are to create a custom report, a custom dashboard, or to create a shortcut. A custom report surfaces the particular Google Analytics you want for your LH3 site into one report. A custom dashboard is a visual overview of different reports you may want. In order to create a custom report or custom dashboard, please see the Toolkit section on Customizing Google Analytics. A shortcut remembers your settings so you don't have to reconfigure a report each time. To create a shortcut, please see this Google Analytics resource.
What are the limitations of Google Analytics and what are my options for working around these limitations?
While a robust and comprehensive tool, Google Analytics does have its limitations in the context of LawHelp. First, Google Analytics can be difficult to navigate and it includes many features that may not necessarily be relevant to LawHelp admins (Google Analytics was built for marketers as opposed to webmasters and technologists.) One of the drawbacks of this is that it may include what are referred to as vanity metrics, or - metrics that may not be the most actionable in terms of your LawHelp site. See below for more information on how to pick which metrics may be most relevant to you.
Also, Google Analytics is great at surfacing the most popular items (those pages with the most pageviews, most clicks, most visitors, etc), but it can be more challenging to find comprehensive information on channels and categories. Specific resources can be accessed easily through the search bar, but you may need to reach out to support@lawhelp.org to run a report based on channels and category information needs.
Another concern is the accuracy of Google Analytics' metrics. Google Analytics works by tracking the cookies on a users browsers. However, many web browsers offer users the ability to turn these cookies off. This prevents Google Analytics from tracking a user's activity. There are additional shortcomings in the way that Google captures data (i.e. the use of sampling) that may affect the accuracy of Google Analytics and may return different results than other analytics tracking tools. Note also that while Google Analytics accounts for most bots, some bot traffic may not be captured in your reports.
Why are my Google Analytics metrics different from other analytics tracking numbers?
Please see above for more information.
If I have additional reporting needs beyond Google Analytics, what can I do?
If your reporting needs are not met by Google Analytics, reach out to support@lawhelp.org. Here is what we will need to provide you with the report:
- A two-week notice so that our developers have time to run your report, as well as when you will need the report
- A date range for the required metrics
- What analytics you will need i.e. pageviews, users, etc. Please be specific
- What channel, topic, category, pages, etc you will need
- Any other additional information that may be relevant
What information will I need from Google Analytics for IOLTA and LSC reporting?
Please refer to the section on Your LH3 Site Reporting Needs for more information.
Does Google Analytics provide information of downloads?
Yes, it does. While not included as a standard Google Analytics feature, our developers have made a configuration that allows Google Analytics to track downloads numbers for your site. You can access this information through the following ways:
- For total number of site downloads: Behavior > Events > Top Events
- For site downloads by file type, go to Behavior > Events > Top Events, and then click on "Downloads"
- Then, select either PDF, DOC, HTM, etc.
- For number of downloads by resource, use the search bar to enter in a resource's unique identifying tag from the URL while in Behavior > Events >Top Events. We recommend using the resource title as the identifying tag, as this will account for all link pathways to a particular resource.
- For example, http://www.lawhelpmn.org/files/1765CC5E-1EC9-4FC4-65EC-957272D8A04E/attachments/BAFD3F15-896E-481E-85C5-759C512CBB32/f-1-getting-child-support.pdf, "getting-child-support" would be the unique identifying tag.
Contact Pro Bono Net should you wish to get download/link information for specific topics, categories, or channels.

How can I find information for:
- Specific pages on my site?
You can find page views for specific resources by utilizing the search bar in a report. Simply copy that resource's unique identifying tag from the URL and paste into the Search box.

- Specific topics?
You will need to contact support@lawhelp.org for metrics on the resources associated with a specific topic, but you can get general landing page view metrics on a topic landing page by using the search bar to enter in your LH3 site's topic URL. For example, "/issues/housing."
- Categories?
You will need to contact support@lawhelp.org for metrics on the resources associated with a specific category, but you can get general landing page view metrics on a category landing page by using the search bar to enter in your LH3 site's category URL. For example, "category=evictions."
- Specific channels?
You will need to contact support@lawhelp.org for metrics on the resources associated with a specific channel, but you can get general landing page view metrics on a channel landing page by using the search bar to enter in your LH3 site's channel URL. For example, "channel=self-help-resources."
How do I determine which analytics are right for me?
This is perhaps the most important question you will need to answer when thinking through Google Analytics for your LawHelp3 site; the answer requires a careful approach.
The first question you should ask yourself when trying to determine the answer to this question is:
- Who is my audience?
- My board?
- Technology decision-makers?
- My Executive Director?
- My funder?
- My development team?
- My outreach team?
- My content team?
Once you answer this question, you can ask yourself:
- What does my audience need to see? What will be most useful to them/ what information can they use to make decisions around our site?
The answers to these two questions will help shape which metrics you select for reporting. For example, a technology decision-maker may be interested in seeing what mobile devices individuals are using to access your site. Your board and funders may be interested in visitor/page view metrics. Your content team may be interested in page bounce rates. Your development and outreach teams may be interested in social media analytics.
This also raises an important discussion about vanity metrics vs. actionable metrics. Vanity metrics are those data sets which might be tempting to use, but that do not accurately give you guidance and reflect key drivers of your site's success. Actionable metrics are those analytics that help you make decisions towards a more successful LawHelp site.
The questions above will help you narrow down what analytics may be "vanity metrics" for your site, but we also did some additional research as to what analytics you may want to start with first when trying to identify actionable metrics. The metrics below were determined through a Google Search of web resources and blogs written on the subject, as well as identification of LawHelp-friendly, actionable analytics.
Focus on trends over time in the following area:
- Users
- Unique Users
- User Flow
- Page views
- Unique pageviews
- Bounce rate
- Navigation summary
- Entrances
- Exits
- Audience > Mobile
- Traffic Sources > Sources > Referral Traffic
- Traffic Source> Social
- In-page Analytics
- Behavior > Site Content > Landing Pages > Entrance Paths
- Behavior > Site search> Search Terms
What metrics are you finding most helpful, and how are using them? Let us know at support@lawhelp.org so we can add them to this toolkit!
Other Resources
Analysis Exchange
Web Analytics DEMYSTIFIED is a Google certified partner site that offers a very helpful program for nonprofits. Their Analysis Exchange program is a free service that pairs non-profit organizations with a trained student/mentor team looking to gain more Google Analytics experience. John Freeman, the supervising attorney at Legal Services State Support has utilized the Analysis Exchange program for ProJusticeMN, and found it to be "terrific". An executive summary of how ProJusticeMN utilized this service is available here. For questions on how your might utilize this resource for your LH3 site, please contact support@lawhelp.org.
Google Resources
Google itself has a large number of resources dedicated to helping its users better understand and interact with Google Analytics. While they can be difficult to navigate, you can find comprehensive there. Here are some specific resources that may be of interest to you:
- Get Started - Working with Report Data: Training presentation on understanding the basics of Google Analytics data.
- Google Videos: Brief training videos on a number of topics, ranging from beginner to advanced.
- Help Center: provides comprehensive documentation on using Google Analytics.
- Certified Partner Network: If you decide to invest in a Google Analytics certified expert, this database lists companies carefully vetted by Google.
LawHelp Community Resources
- LawHelp listerv: Can't find an answer to your question? Your colleagues may know! Try sending your question out to the LawHelp listserv. You can sign-up here.
- LawHelp Blog: Be sure to check-out the LawHelp blog for the latest insights into Google Analytics for LawHelp admins, including suggestions for how Google Analytics should be used, tips and tricks, new resources, and more.
- Evaluate Your Site: For other resources on measuring your site's success, check out the SWEB library resources in this folder.
Additional Questions/Need Help?
Please contact the support@lawhelp.org HelpDesk with any Google Analytics questions.
Special thanks to Gwen Daniels and Lindsay Ditto at Illinois Legal Aid Online for additional input and guidance on using Google Analytics for statewide legal aid websites.